Case study 'family values'
Similar and yet completely different
In process simulations, users too often rely on extrapolated material data or data for supposedly similar materials. Studies on fiber-reinforced plastics clearly show that such “family values” cannot replace individual measurements of the compounds. A case study from the Moldex3D database.
With the range of processing methods for plastic melts, it isdifficult to find general rules for opti- mum process conditions. To retain proprietary know-how and maintain a competitive edge in the highly competitive market place, companies often rely on special processes, modifi- cations and clever process combinations.
Manufacturers of compounds also make use of their specialized knowledge for producing unique high-quality materials or optimizing their price/per- formance ratio. In digital product devel- opment by CAE (computer-aided engineering), the properties of these compounds are a considerable competitive factor. They are therefore deter- mined in the lab and made available in material databases and simulation tools. In the primary shaping process by injection molding, the flow and solidification properties are of particular importance.
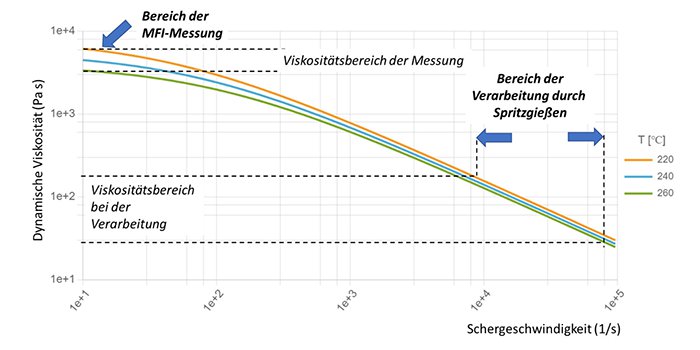
The flow of a thermoplastic melt is described by the dynamic viscosity. It depends on the effective shear rate. The greater the shear rate, the lower is the melt’s viscosity – the more easily it flows, the faster it moves. This property is determined with each characteriz- ation of a plastic in the high-pressure capillary rheometer (HCR) and, after application of the necessary correction factors, is represented in the double logarithmic network. The shape of the curve is characteristic for thermoplastics and belongs to a basic knowledge of plastics technology (Fig. 1).

Fig. 1. Shear viscosity with the example of a polypropylene at three temperatures and shear-rate ranges for MFI measurement and injection molding [1].
The diagram also illustrates that the measured flow index (MFI or MFR) is a characteristic that describes the viscosity measured at very slow flow rates. It usually has little to do with the behavior during processing. The precise form of the viscosity curve is different from material to material, i.e. similar MFI values do not necessarily lead to a similar flow behavior during processing (see “Range of processing by injection molding” in the graph). If comparative or alternative materials are required, the viscosity curves must also agree as much as poss- ible to the relevant processing rates.
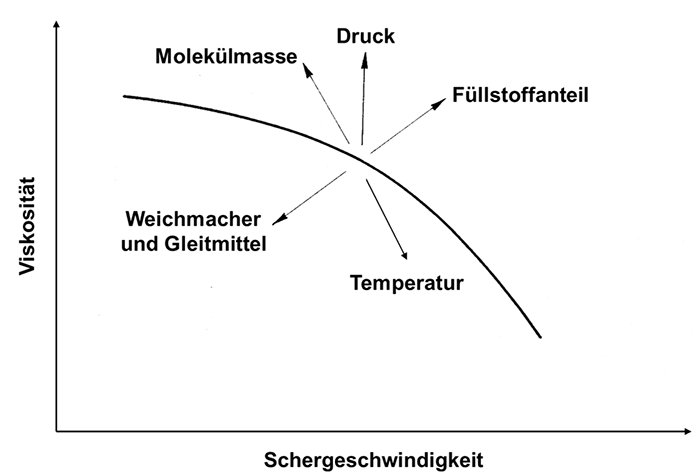
The viscosity is influenced not only by process parameters such as pressure, temperature and velocity but by all the ingredients of a compound formulation, such as plasticizers and fillers, as well as the molecular weight of the polymer.
Although the curve remains shear dependent, like the temperature change, it is shifted in a particular range by the modifications (Fig. 2).

Fig. 2. Fundamental influences on the viscosity of a thermoplastic (-compound) melt [2].
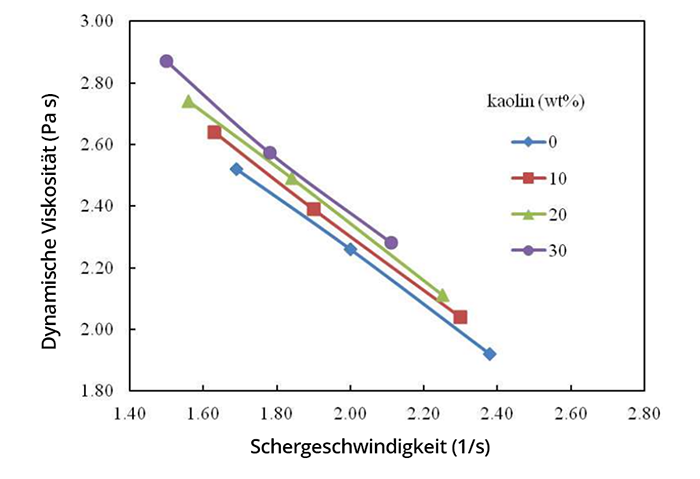
If, with a compound, only the pro- portion of functional fillers, such as fibers or minerals, is changed and otherwise the formulation remains completely the same, then the viscosity curve follows the above-described law within certain limits: With increasing filler loading, it shows more viscous flow (Fig. 3).

Fig. 3. Viscosity as a function of the filler content of kaolin for otherwise the same formulation, shown at small shear rates [3].
For modern product and process devel- opment using CAE, this material charac- terization is essential. Despite its many advantages, however, this technology is often neglected. The counter arguments cite the large number of available ma- terials or a small purchase volume,
which allegedly make the additional cost unrealistic. Very often, the question about the desired material data is also answered with “suitable comparable materials that are already present in the databases” – this procedure shows that the process simulation is often regarded as an additional expense. Sustainably successful companies, on the other hand, have been demonstrating for decades that high value creation and an immense gain in knowledge are the results of the smart application of pro- cess simulations.
If this potential is not recognized, the material characterization remains primarily a cost factor at first. This raises the question of whether a family of similar formulations can be purely hypothetically constructed as a “family dependency”, which would reduce this cost factor.
In this concept, a manufacturer of compounds characterizes a formulation with, for example, 20 % and 50 % glass fibers according to its rheology and material. The values “in between” are assumed to be more or less linear and estimated correspondingly. By the same arguments, similar considerations on the market require that the in- fluence of masterbatches (highly con- centrated color or additive compounds)
This requirement to reduce the measurement effort is to be assessed using the viscosities and solidification behavior of engineering plastics (PA66 glass fiber compounds) from different manufacturers and with different fiber contents. For this purpose, existing test data of similar technical compounds are selected and converted into com- parison diagrams. Based on the fiber contents, the flow and solidification data are compared and discussed with reference to the hypothesis of “family values.”
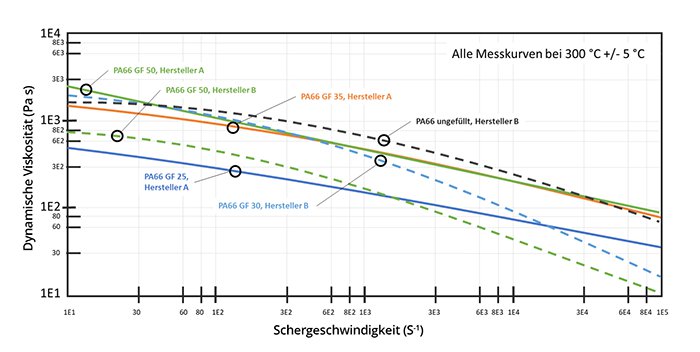
The viscosity curves of a total of five engineering plastics (PA66 compounds with glass fibers) from two manufac- turers were presented in a comparison diagram. In addition, an unfilled, rapidly solidifying PA66 was assessed. For this purpose, the shear-rate-dependent viscosity ranges are compared (Fig. 4).
The chosen compounds with a glass fiber content of 50 wt. % show a similar shear dependency depending on the manufacturer, but they have clear differences in the magnitude of the viscosity, about 5-fold at low shear rates and about 30-fold at high veloc- ities. The compound from manufacturer B is significantly less viscous overall. A formulation from manufacturer A with 35 wt. % glass fibers confirms the as- sumption of a lower viscosity with less filler content at first. However, this be- havior only applies at low shear rates up to approx. 500 s-1, after which the vari- ants with 35 and 50 wt. % fibers show very similar flow. With a glass fiber content of 30 wt. % from manufacturer B, it is not clear at all that a lower fiber content would also reduce the viscosity. On the contrary – the compound generally reacts by showing a higher viscosity, even though it con- tains less glass fibers.
Finally, an unfilled PA66 from manu- facturer B was compared, which, by the argument that an increasing degree of filling causes a higher viscosity, would have to have very low values. However, this could also not be derived from the material description. No dependency can be seen even with respect to the shear rate.

Fig. 4. Comparative view of the shear-dependent viscosity of different glass fiber contents of PA66 from two manufacturers [1].
he viscosity profiles at different glass-fiber contents of the compounds thus do not follow a shift principle similar to that of the temperature. The respective manufacturers probably put together their formulations by means of molecular weights, additives and lubricants so that they each have typical processing properties for the brand names. The manufacturing conditions during compounding also have an influence, depending on the formulation or on an increased shearing rate, which is to be assumed due to the respective glass-fiber content.
The assumption that the viscosity changes with different glass-fiber contents according to a shift principle can therefore not withstand the test performed based on the values in the data-bases. Empirically, a range of fiber-rein-forced thermoplastics that has been theoretically completely redesigned by the manufacturer would also not follow such a shift principle. Formulations and production influences can probably not be kept constant enough across a compound family such that the resulting viscosities can be purely computationally represented.
From the comparison of the flow curves, it can also be deduced how inadequate an assessment of the MFI can be. An MFI comparison could lead to the assumption that the processing of PA66-GF30 from manufacturer B is not very different from the unfilled variant, since the zero-viscosities are very similar at low shear rates (Fig. 4). However, if the viscosities are compared with one an-other at 104 s-1, there is roughly a three-fold difference. Such an alternative material would cause considerable difficul-ties in injection molding.
After the flow process, solidification from the melt, represented by the pressure-and temperature-dependent volume change (solidification shrinkage, pvT), is an important factor in the process de-sign. The temperatures and pressures at which the compound solidifies are process-determining. With the example of the same semicrystalline glass fiber filled compounds, the material behavior is shown and assessed in a pvT compari-son diagram.

Fig. 5. Comparative view of the pressure- and temperature-dependent volume change and solidification points of different glass fiber contents of PA66 [1].
n the diagrams (Fig. 5), the pvT curves correspond to the basic physical laws that the curves are lower with increasing glass fiber content; the ma-terials therefore have a higher specific density because the glass fibers are significantly heavier than the polymer. Although this dependency can be pre-dicted from the fiber content, that alone is not a sufficient aspect of the material behavior to predict the solidification from the melt. The relevant characteristic is the solidification temperature, i.e. the bending curve range, in which the crys -tallites first start to form. In the formu-lations under consideration, this does not follow any regular pattern. It can be assumed that formulation components, such as nucleation agents, determine the character of the solidification and that the solidification behavior does not follow a law that can be determined by calculation. This also applies to the other additives used in compounds and their typical components, such as clarifiers (<< 1 %), lubricants (< 1 %), demolding aids (<< 1 %), optical brighteners (approx. 1 %), pigments (< 10 %), crosslinkers
(< 10 %), chemical blowing agents (< 5 %), flame retardants (< 50 %), bio-cides (< 10 %), emulsifiers (< 10 %), anti-static agents (approx. 1 %) or recycling additive packages (< 10 %) [2].
(< 10 %), chemical blowing agents (< 5 %), flame retardants (< 50 %), bio-cides (< 10 %), emulsifiers (< 10 %), anti-static agents (approx. 1 %) or recycling additive packages (< 10 %) [2].
Summary
To generate family values for technically similar compounds based on a few measurements and derive further values from them cannot be regarded as promis-ing for the reasons described in this study. Meaningful results of computer-aided product development are based to a large extent on reliable material data, which can be estimated in their origin and stability during the production process and are demonstrably suitable, as shown by our own validation tests. Because of the need to respect the confidentiality of compound and masterbatch formulations, it does not appear promising to derive fundamental and universally valid depen-dencies between the ingredients of a composition and its flow and solidifi-cation properties.
In our opinion, material charts from the laboratories of the respective suppliers of CAE software offer the best option for successful digital product development. For example, the Simpa-Tec expert team assists users in selecting materials, characterizing them and transferring them to the Moldex3D database. So, the combination of high-quality simulation and customer-oriented consulting can ensure a short and efficient path to product and process optimization.
In our opinion, material charts from the laboratories of the respective suppliers of CAE software offer the best option for successful digital product development. For example, the Simpa-Tec expert team assists users in selecting materials, characterizing them and transferring them to the Moldex3D database. So, the combination of high-quality simulation and customer-oriented consulting can ensure a short and efficient path to product and process optimization.
Literatur:
[1] Materialdatenbank CoreTech System Co. Ltd. “Moldex3D”, Release 2023R3OR
[2] Michael Bosse, Vorlesung “Aufbereitung von Compounds”, Technische Hochschule Würzburg-Schweinfurt, 2022
[3] Zulkifli Mohamad Ariff, Azlan Ariffin, Suzi Salwah Jikan and Nor Azura Abdul Rahim (2012). Rheological Behaviour of Polypropylene Through Extrusion and Capillary Rheometry, Polypropylene, Dr. Fatih Dogan (Ed.), ISBN: 978-953-51-0636-4, InTech, Verfügbar unter: https://www.intechopen.com/books/polypropylene/rheological-behaviour-of-polypropylene-through-extrusionand-capillary-rheometry
Copyright:
_ Moldex3D is a registered trademark of CoreTech System Co., Ltd., Taiwan.
_ Picture (Header) with kind permission of Carl Hanser Verlag GmbH
Published:
Originally published in Plastics Insights 4 (2024), pp. 40-33. Reprint with kind permission of Carl Hanser Verlag, Munich/Germany.
